Woah! It's
A full-stack web developer.
Quick and efficient code that minimizes lag is the name of the game.
Websites are built for all device widths and support most common browsers.
I strive to produce code that is clean and easy to service.
I'm a husband, a father of two, a nerd about most things nerdy, and a diehard maker. I hold a BS in Computer Science from Appalachian State and have been a professional developer since 2004.
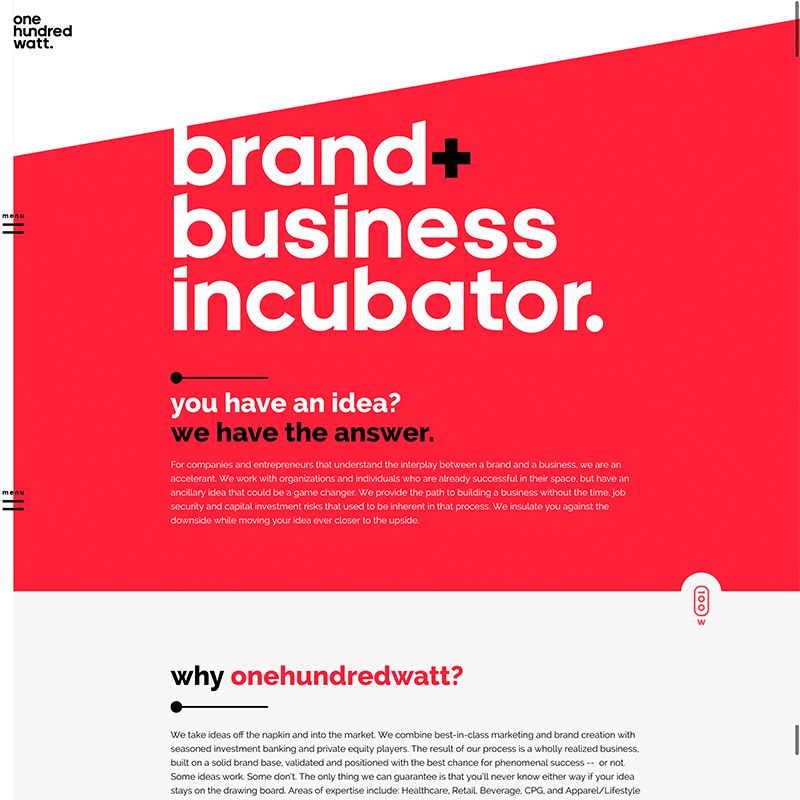
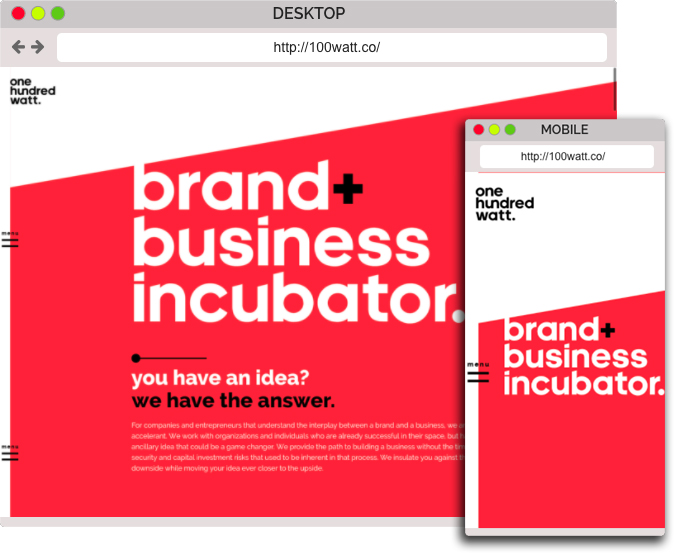
This website was a fairly straightforward affair. They were just starting up and needed a new website to showcase their services. Design was ready and off I went. I peppered in a few visual things that I had never tried before such as the use of Vivus.js to animate the SVG hero text and the sequential animation of the case study section.
Everything was built on Wordpress for ease of manageability and organization.
Mostly how to do some weird sequentially timed animation stuff and keep it within CSS3 if possible. I had played with this before but never used it on a production site. It was cool to see how smooth everything animated and how easy it was to tweak animation timing.
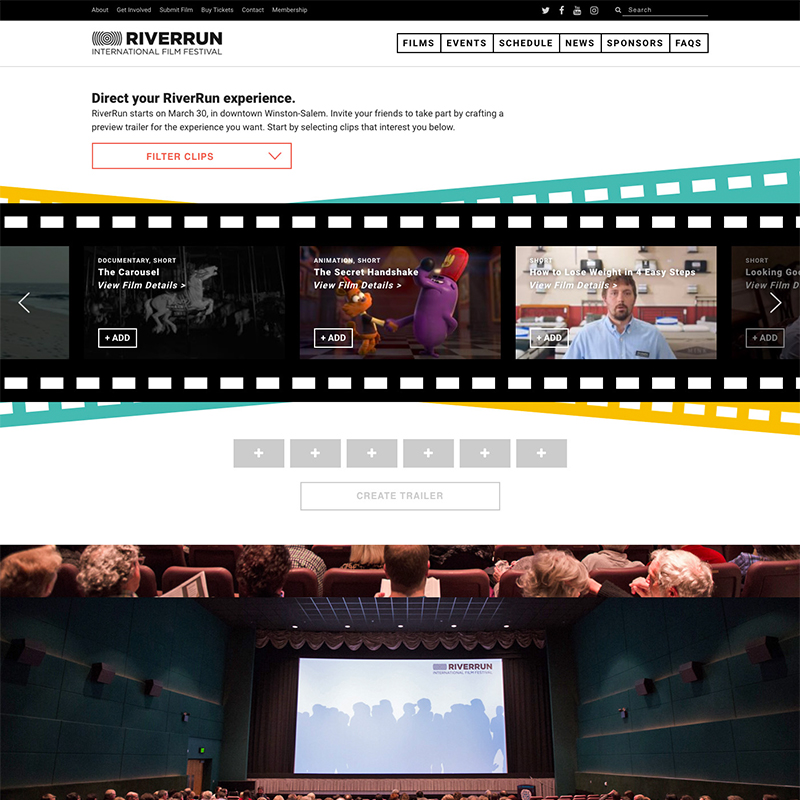
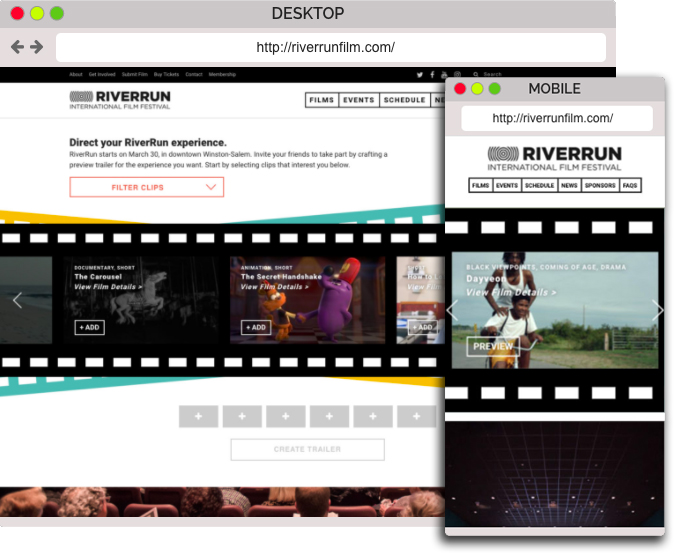
Every year, The River Run International Film Festival draws people from all over the globe to review films of cultural and artistic importance. Wanting to put fans in the editor's chair, I developed a way for site visitors to build their own custom River Run trailer using clips from movies being shown that year.
The user can select up to 6 clips (30 seconds total), set their own music and write a custom tagline. Clips can be reordered or deleted in the creation process. Once complete, the video can be shared via social media or email with a custom link.
Asynchronous mp4 video loading and sequential ordering of the clips was a challenge. Also, mobile doesn't like manipulating video elements so we could only build this for desktop. However, the response to this was amazing and would have loved to take this project to mobile via server-side video processing tech.
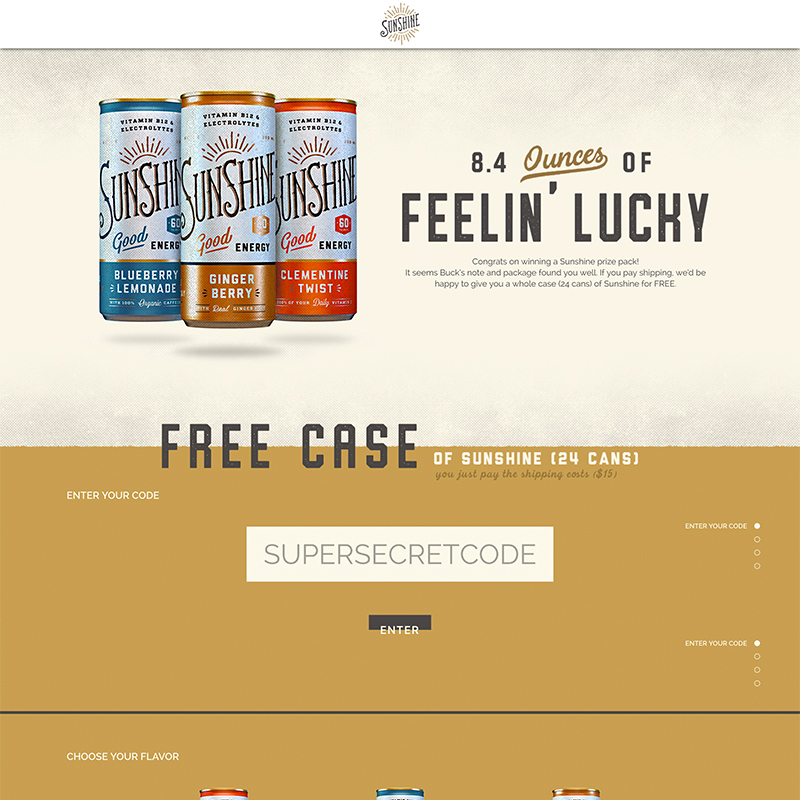
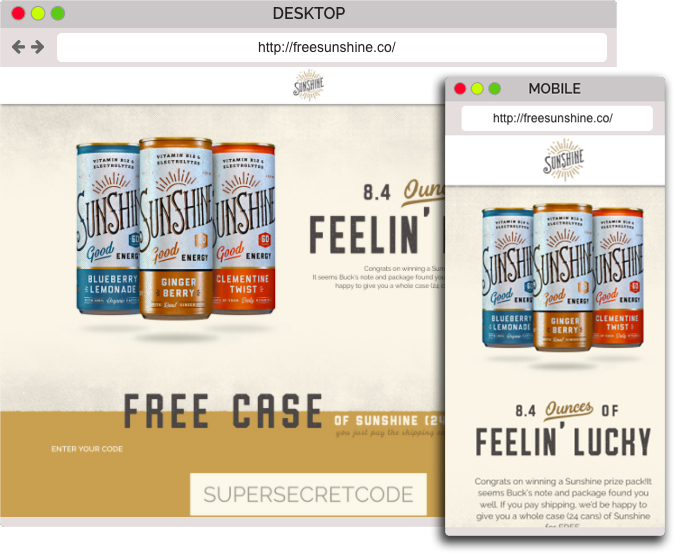
What do you do when you have a last minute engagement at a tech conference, and you need a way to hand out samples without carrying cans of energy drinks in your pockets? Also you have a week to build it. You build freesunshine.com!
The goal was to be able to hand out a secret coupon code on the back of business cards at the DIG SOUTH conference which could be redeemed for a free case of Sunshine energy drink. The only catch is you would need to pay $15 to ship (fizzy drinks are expensive to ship). This was a tech conference and they needed a redemption website quickly. So I turned to Wordpress and Woocommerce.
The tricky bit was not only the timeline, but also keeping the order flow on one page and keeping it responsive. So I set forward implementing the front-end design, setting up Woocommerce, and integrating Stripe credit card payment. We came in under the buzzer (4 days development total) and even had a day to thoroughly test.
The website was a hit and we received several orders from people ready to drink in the sunshine.
Knowing the right tools for the job and having an amazingly flexible (and talented) designer is the key to any fast dev job.
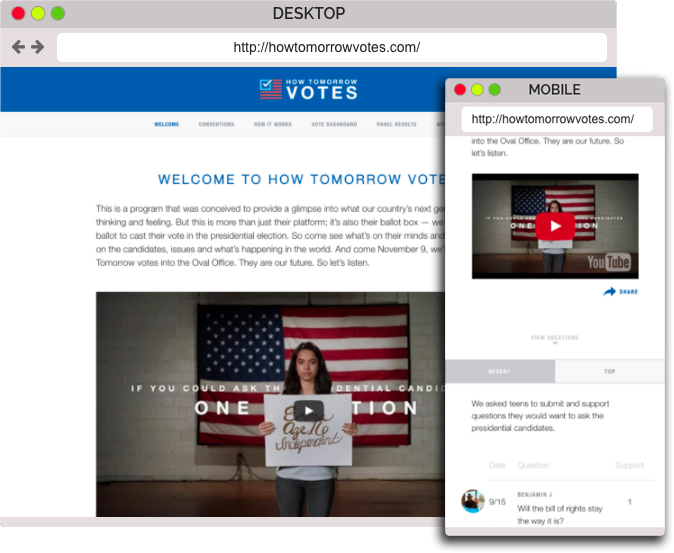
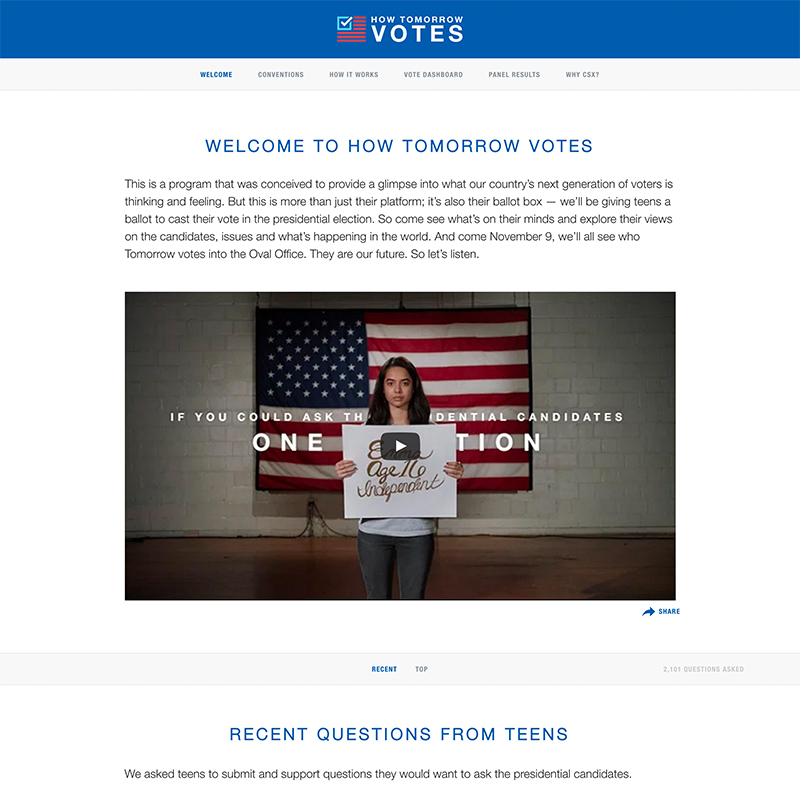
For the 2016 election year, CSX wanted to engage the next generation of voters and allow their voices to be heard. This website was built with two sides: Enaged Teens and Engaged Citizens. On the teen side, users would log in with their Facebook account for age and location verification. Once logged in, they were allowed to provide their political view (liberal, conservative, moderate), vote for their preferred candidate and ask questions intended for either candidate. Questions could be up or down voted by other logged in users to rate the most important questions.
On the Citizen side, Adults could review stats of how votes were being cast as well as read the questions being submitted to the candidates. This section was my responsibility.
On the main page of the citizen site, visitors can view a video explaining the campaign and review the top rated questions. Each question is explorable with voting statistics separated by gender, age, and political view and sorted by level of support.
The "Conventions" tab highlighted four teens who CSX sent to Washington, D.C. to speak with government representatives about issues important to them. This included an overview video, profile for each teen, and a slide show of memorable moments.
A "How it Works" section explained how the information was gathered and who the next generation of voters will be.
"Vote Dashboard" provides the meat of the statistical data. All data was updated in real time so the most recent activity would be available to the viewer. All data was arranged graphically and the issues voted most important were highlighted front-and-center. Statistical visualization included a graph of voter participation, an interactive U.S. map showing participation origins, a bar graph ranking chosen political issues, and a bar visual showing distribution of political affiliation.
Overall, the project had many surprises as client and visitor needs constantly changed. Many sections were built and rebuilt to suit the ever changing climate of an election year. Many long days and sleepless nights were put in by myself and the entire team to ensure our best work was put forward. Initially, we felt things went off the rails when Donald Trump was predicted as the election winner, but were surprised that it was a solid indicator of the actual election results.
Success of this project was well earned and it taught me to never underestimate the power of having an amazing development team.
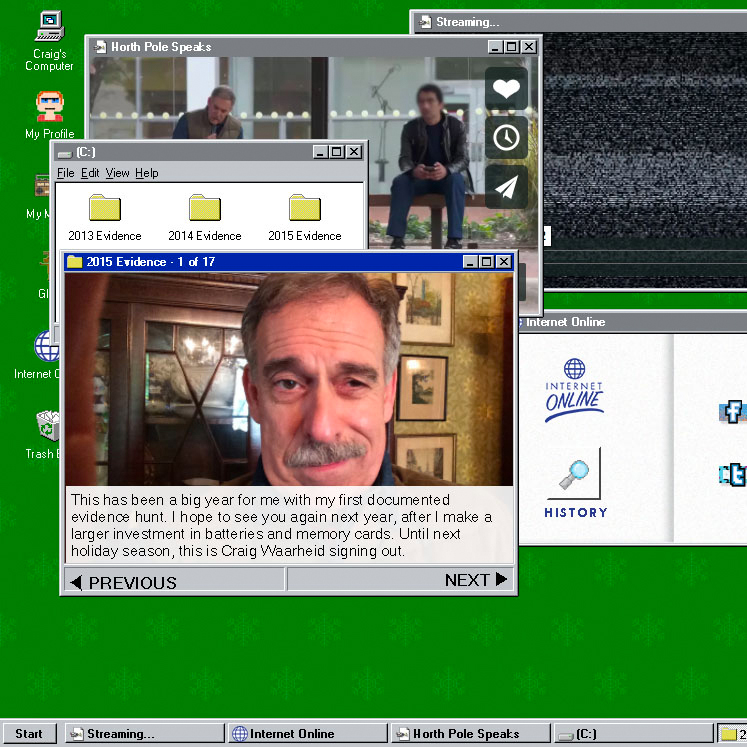
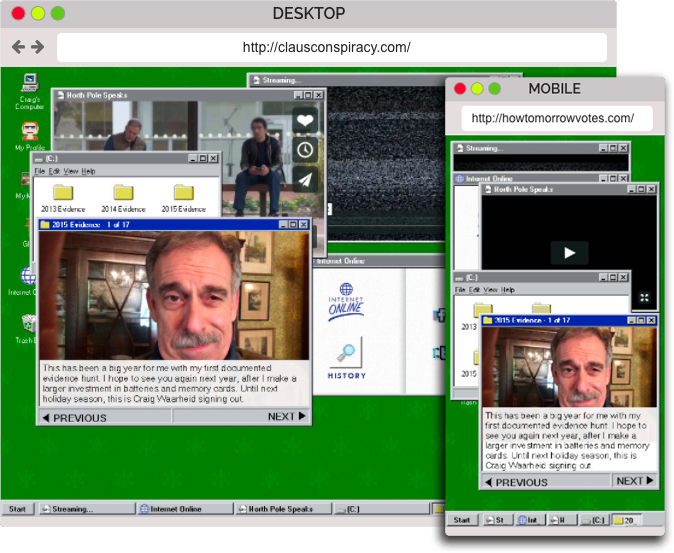
Have you ever held a conspiracy theory to close to your heart and been so convicted that you allowed remote desktop access to you computer? Would you do it to prove your theory through complete transparency? Me either. However, Craig N. Waarheid isn't us. Convinced that CSX is helping Santa Claus deliver his gifts, he compiles his compelling evidence and unleashes it on the public each year.
Our task initially was to create the most low-fi, 1996-esq website possible (think Geocities or Angelfire days). Then, the idea hit us; why not recreate a Windows 95 desktop in a browser?
I set to work. Forking a half-finished project by zyphlar on GitHub, I laid into the project to tighten up the Windows 95 experience, create multiple window types, a pseudo file system and making it fully responsive (Windows 95 on a mobile screen!?). You can see the raw project backbone for the project here.
Once I had the environment set, it was just a matter of plugging in content and testing.
This was one of my favorite projects. It allowed me to reconnect to the early days of desktop computing and gave me a deep appreciation for the work that went into building a user experience that set the foundation for modern operating system UI/UX.
Low-fi is the new high tech.
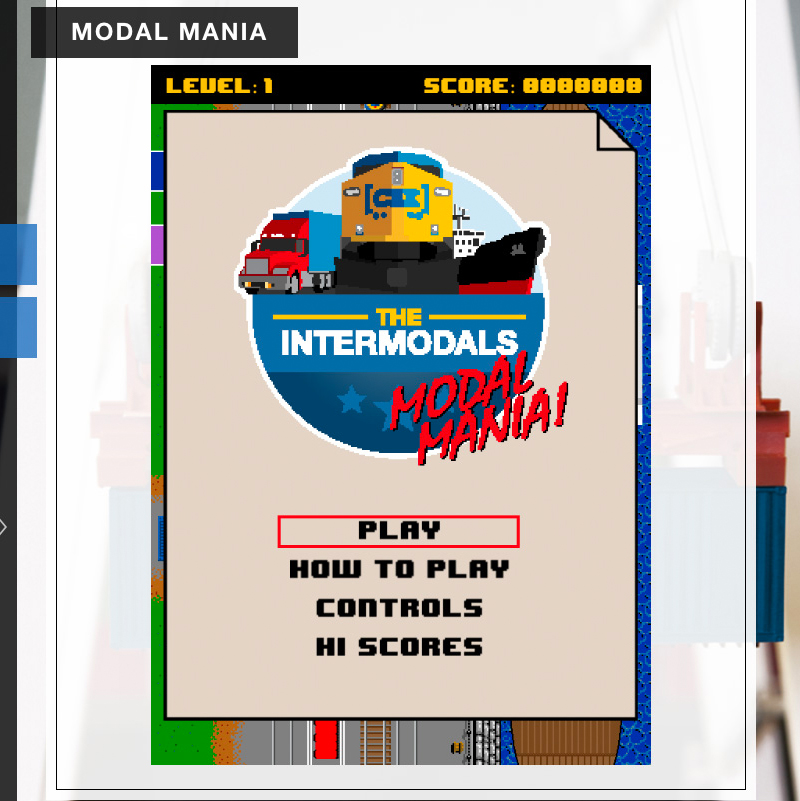
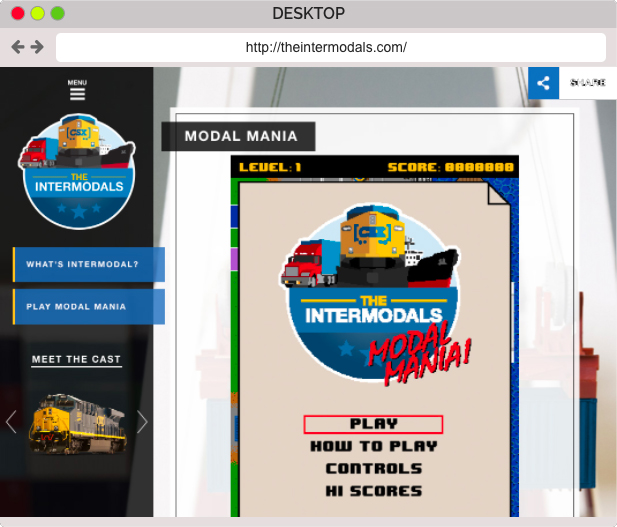
It's Intermodal Transit Mania! CSX needed to increase awareness of their intermodal logistics which can take cargo from a boat to a train to a truck. This allows cargo to be shipped nearly anywhere in the world.
My role was to complement the website with an interactive game. Along with designer, Dolph Kalawack, we developed the idea of creating an arcade style browser game inspired by the likes of Donkey Kong and Spy Hunter. Developed using the Phaser framework, I quickly created an fun, engaging and non-violent video game (labeled internally as "Trucky-Boaty-Train") with a live leaderboard and the ability to share your high score on social media.
The object of the game is to drop the container on the the correct mode of transit. Success in the game means the action progressively gets faster and faster. Drop a container on the ground or on the wrong transport vessel, and it's Game Over.
The joy of creating a simple, low resolution 16-bit game in the browser.
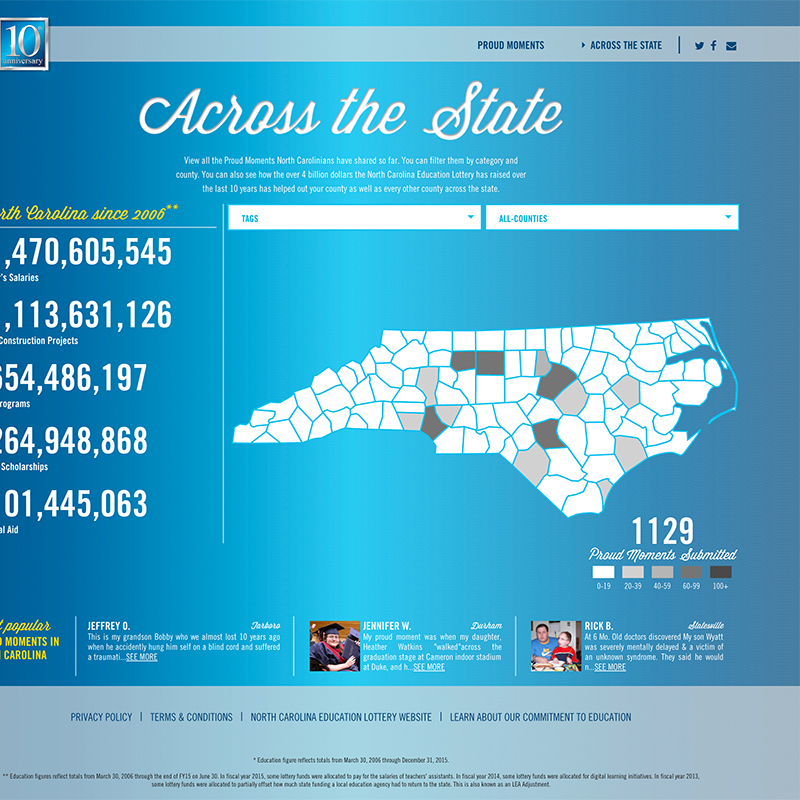
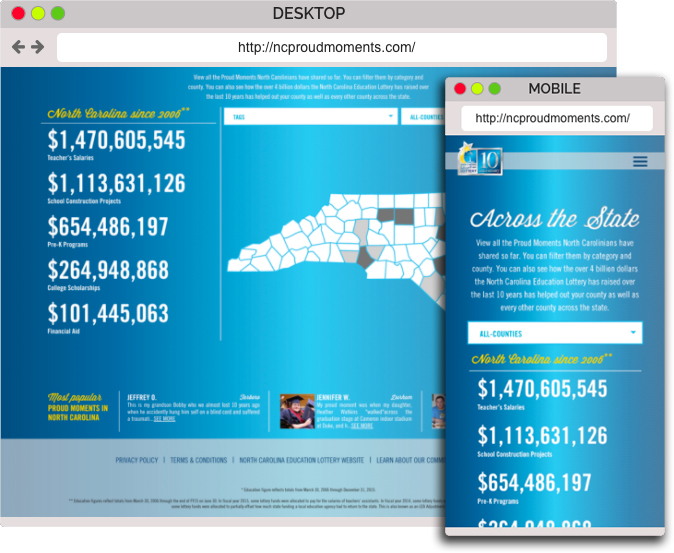
With a focus on proud moments in education, the North Carolina Education Lottery wanted to create a way for citizens of NC to submit their proud education momnents for a chance to win a $10,000 cash prize. Users can submit their stories along with videos or photographs. Submissions were moderated via a Wordpress back-end and, once approved, could then be voted on by other visitors. Highest voted stories increased their chance of winning (even though it wasn't the determining factor). Submission data was captured and visualized on an interactive state map.
My responsibility was the submission organization using Isotope and the data visualization on the state map. The state map proved to be a unique challenge as we wanted an efficient way to display data visually without straining the user experience with asset downloads or graphical processing. I settled on using an SVG map that could be manipulated with a combination of Javascript and CSS animation techniques. Data was called from a REST API which allowed up-to-date data to be retrieved each time a request was made.
Quick and efficient data delivery via REST API. Also, it started a love affair with SVG animation.
Have questions or want to work together? Send me some words.